Last update: 2020-03-05
Functions
DIMEROW mainly uses the python plot interactive module
Bokeh v.1.0.4 and
the application NGL 2.0.0 to display the structures on
html. These programs gives to the user some filtering options with an interactive plot and the possibility to
take a look of the structures without installing anything and interact with them. Below, it is explained
the functions that DIMERBOW have:
Bokeh - Interactive plot tools
Bokeh have a lot of tools that the user can use to interact with the plot. Tools more detailed explain clicking
in this link
Bokeh - Usage tools.
DIMERBOW have some of them:
DIMERBOW have some of them:
- Pan
 :
move the graphic
when the user drags.
:
move the graphic
when the user drags. - Box zoom
 :
user can select a rectangular region on the plot and zoom on it.
:
user can select a rectangular region on the plot and zoom on it. - Wheel zoom
 :
user
can zoom with the wheel of the mouse.
:
user
can zoom with the wheel of the mouse. - Tap
 :
activate/desactive
the tap on each point for selection.
:
activate/desactive
the tap on each point for selection. - Reset
 :
return to the
original position.
:
return to the
original position. - Save
 :
save a image of
the plot in .png format.
:
save a image of
the plot in .png format. - Hover
 :
display/undisplay the information when you hover the mouse on a point.
:
display/undisplay the information when you hover the mouse on a point. - Bokeh home: redirect the user to Bokeh homepage.
NGL
NGL is a viewer for molecular visualization that gives a lot of possibilities to display a structure. Controls
are avaliable clicking in this link MANUAL
- Mouse & Keyboard control.
In the case of DIMERBOW, NGL displays somes options:
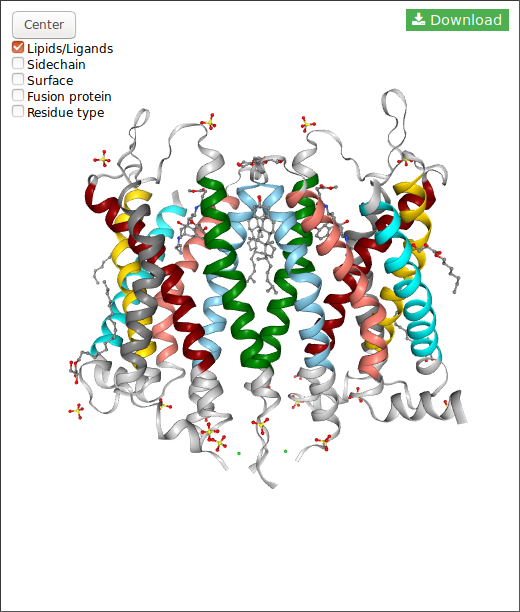
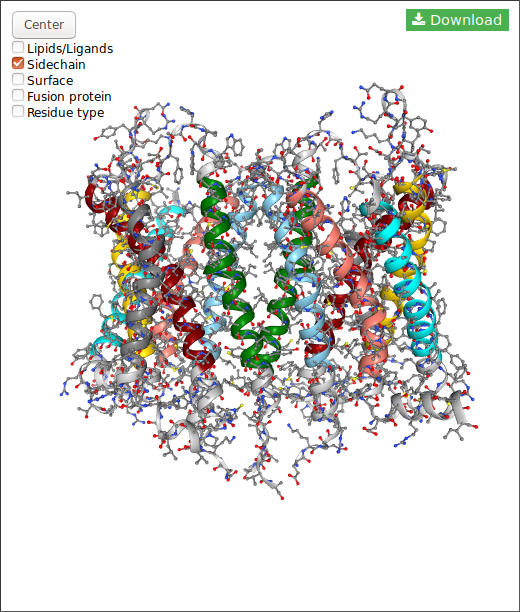
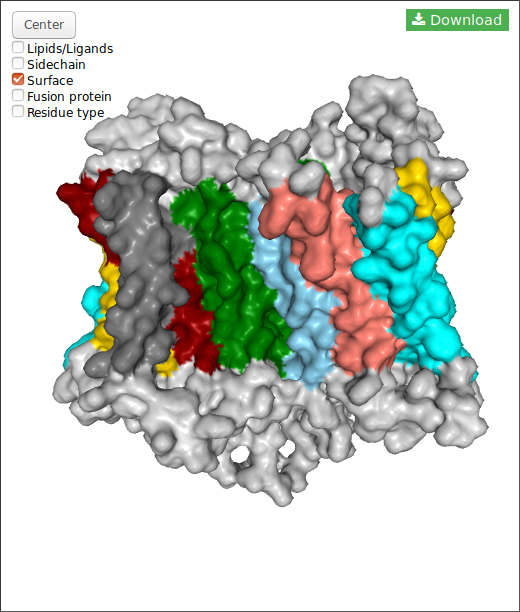
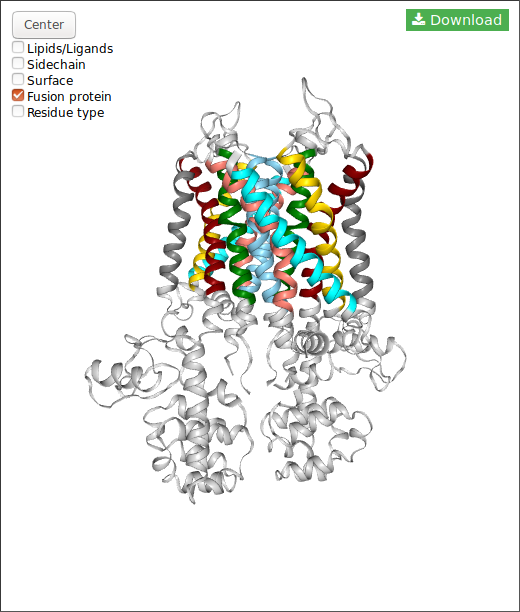
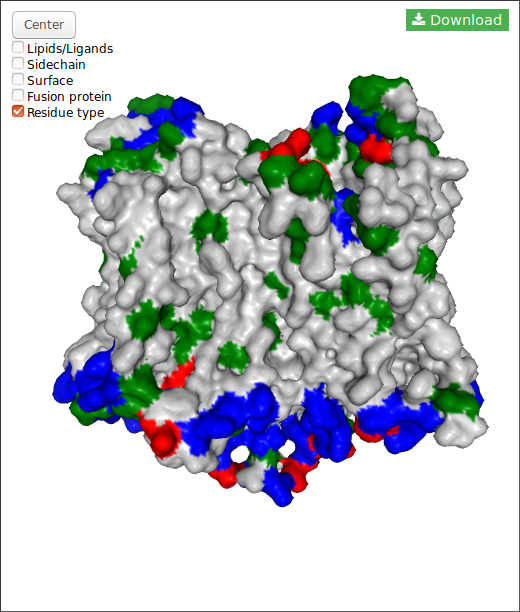
Also, for each structure you can download the structure in pdb format clicking in the button.
In the case of DIMERBOW, NGL displays somes options:
Also, for each structure you can download the structure in pdb format clicking in the button.
Modes
DIMERBOW have two modes:
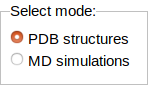
PDB structure mode:
The PDB structure mode display the best possible dimers originated from the PDB structures. In this mode the
user can filter using some parameters provides by the application (explained at the end of this paragrah) to
select the structure or structures that will like visualize.
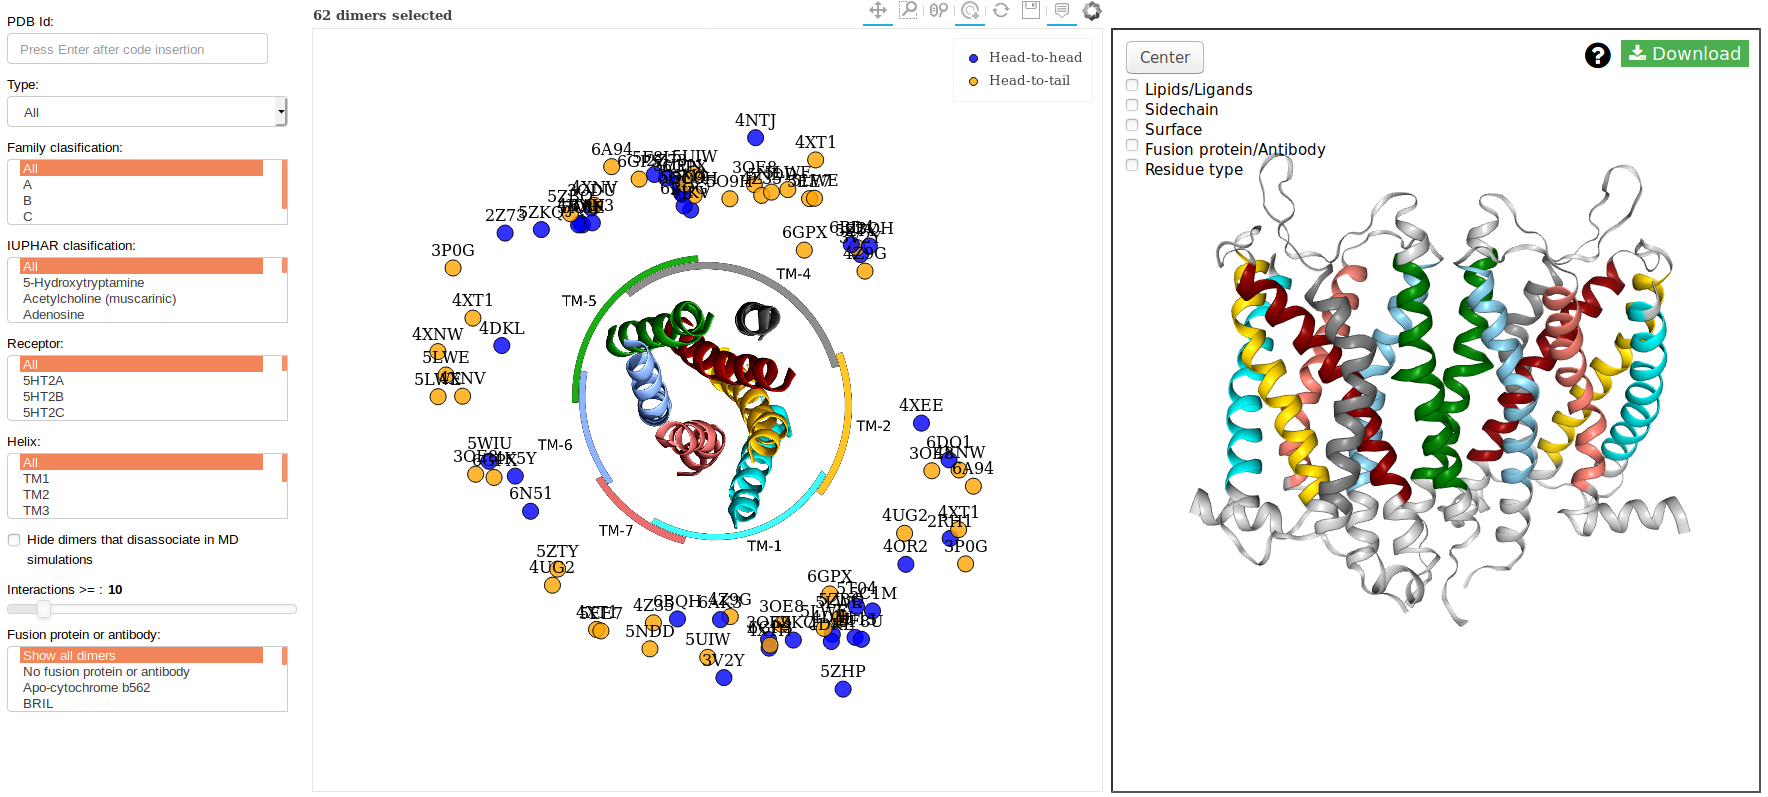
Filters
In the above image you can see at the left some filters that you can apply:
- Reset: reset all the filtering.
- Type: options of symmetry
- Head-to-head, symmetric (blue)
- Head-to-tail, asymmetric (orange)
- Reference: indicate a PDB code and the plot shows the points related with that code or a reference of this code. Press ENTER when you write the code.
- Receptor: select (click) or multiselect (ctl+click/shift+click) the receptors that you want display on the plot.
- IUPHAR clasification: select (click) or multiselect (ctl+click/shift+click) the group of receptors that you want display on the plot.
- Fusion protein: select (click) or multiselect (ctl+click/shift+click) the dimers with fusion proteins or without fusion protein ("-") that you want display on the plot.
- Interactions: limit the minimum number of interactions that dimer contains.
- PDB (without fusion protein).
- With fusion protein.
MD simulations mode:
The MD simulations mode display the possible structure dimers after simulations. In this mode the
user can filter using some parameters provides by the application (explained at the end of this paragrah) to
select the structure that you will visualize. Also, you can display the "crystallographic structure" to compare.
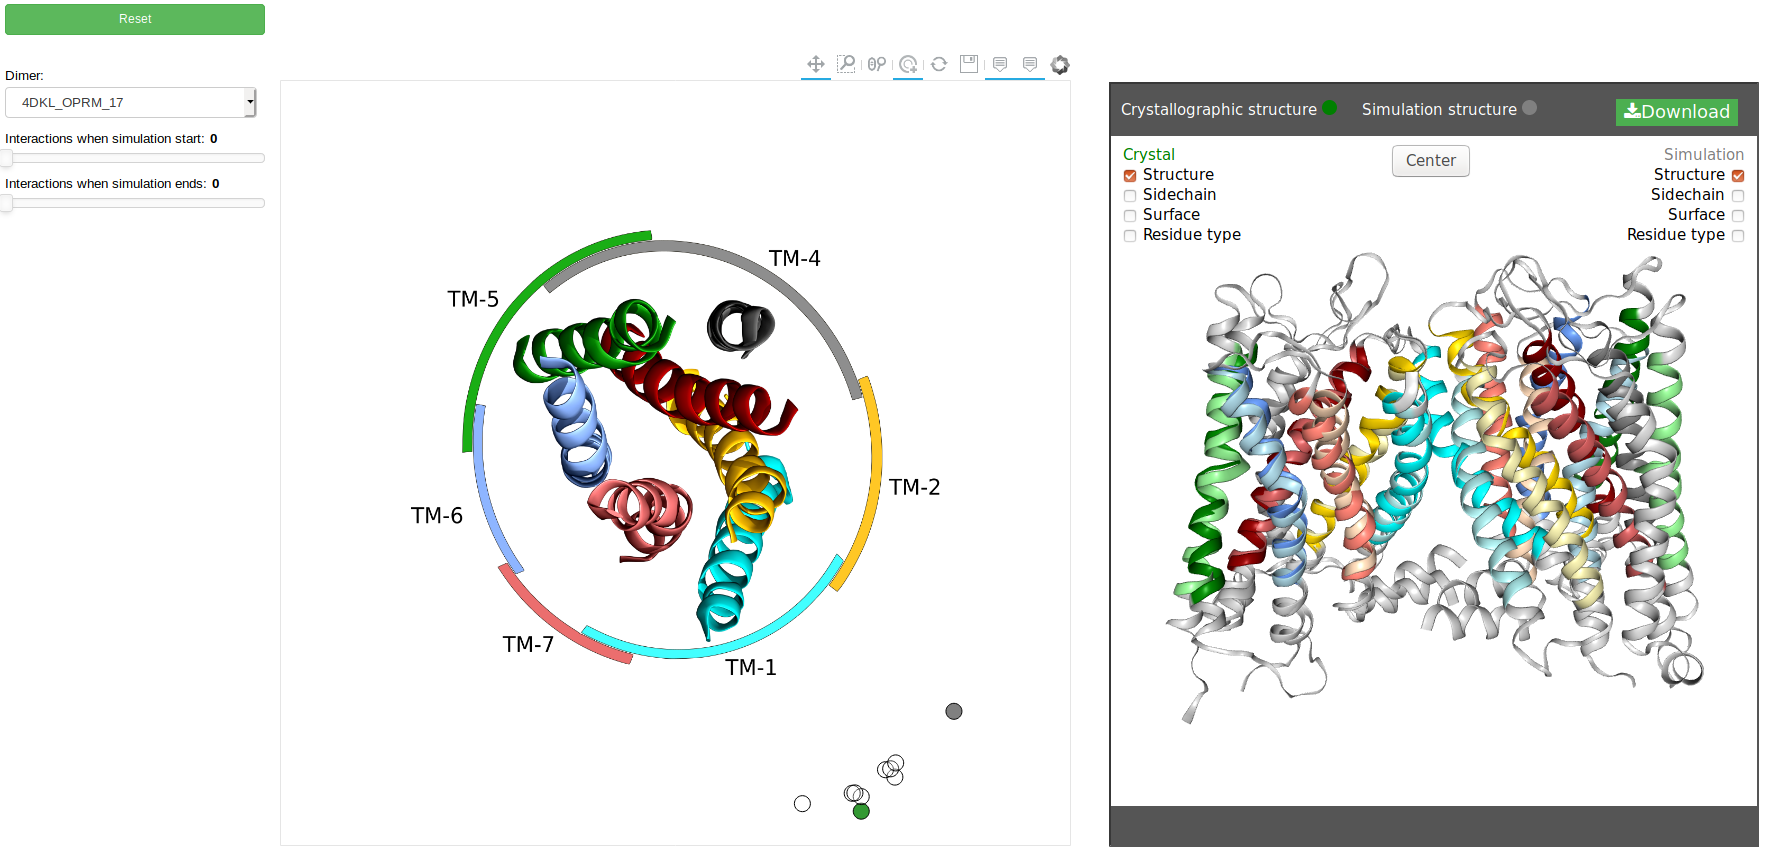
Filters
In the above image you can see at the left some filters that you can apply:
- Dimer: select (click to display the list)the dimer that you want display on the plot.
- Interactions: limit the minimum number of interactions that dimer contains on Coarse Grained.
- Start simulation.
- End simulation.
Examples
Example - 1
This example shows how to use the crystallographic mode and download the structure.